Last Updated: April 19, 2023
Applies to: All registered users
Insights are relevant information and indicators prepared by Doinn to help you learn about your business and become more efficient.
There are 5 tabs: Operational, Financial, Performance, Logistic and Quality so you can analyze from the service duration by each property to the margin by employee/customer.
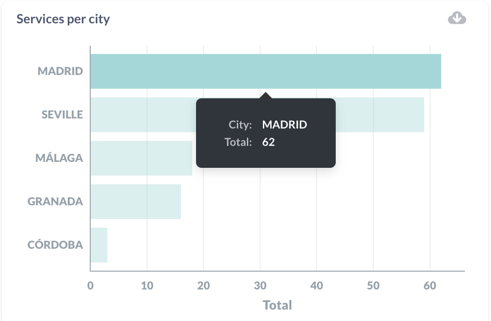
Mouse over to see more information
It’s also possible to forecast and predict the market using insights from previous months or years in order to strategically increase the team.
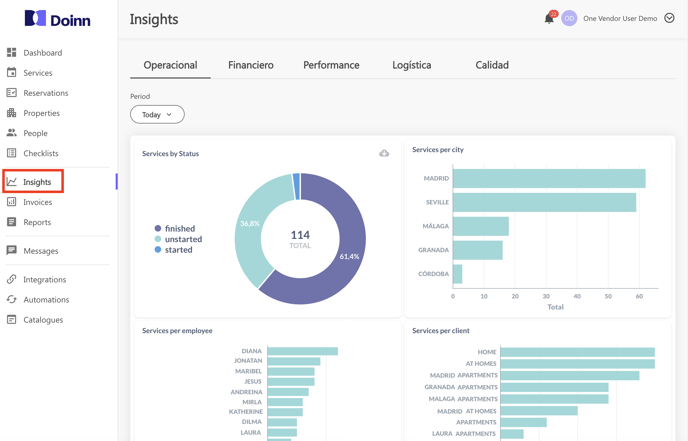
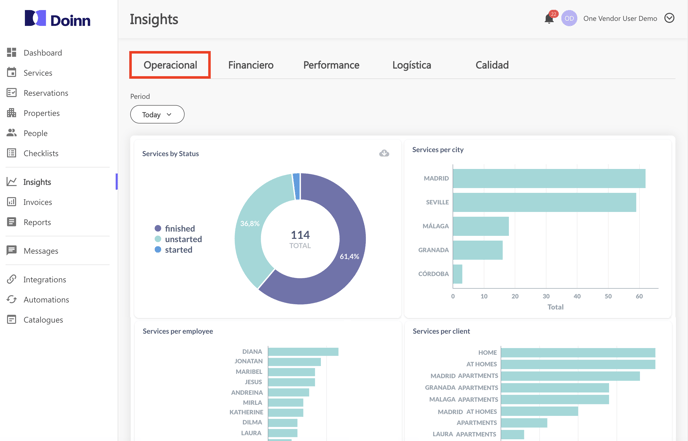
1. Operation Insights
The Operational Insights show you the statistics of your services per status, per city, per employee and per client.
Navigate through the Period filter and analyze your data.
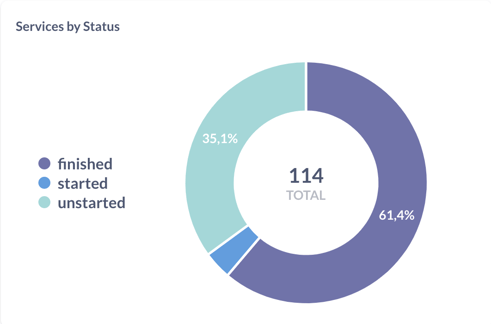
- Service by Status
See the volume and percentage of your finished, started or unfinished services.
- Service per city
See the cities where you best perform

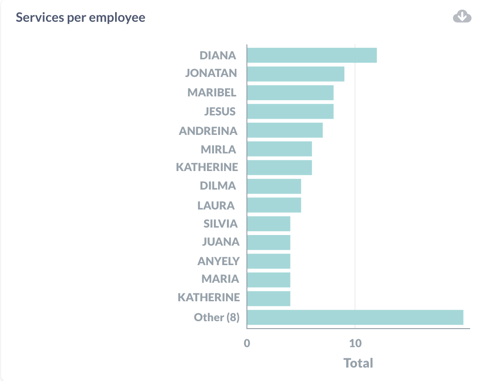
- Service per employee
See the services done by your employees
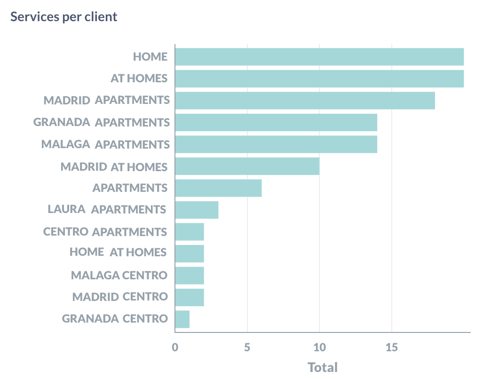
- Service per client
See the volume of the services done per client
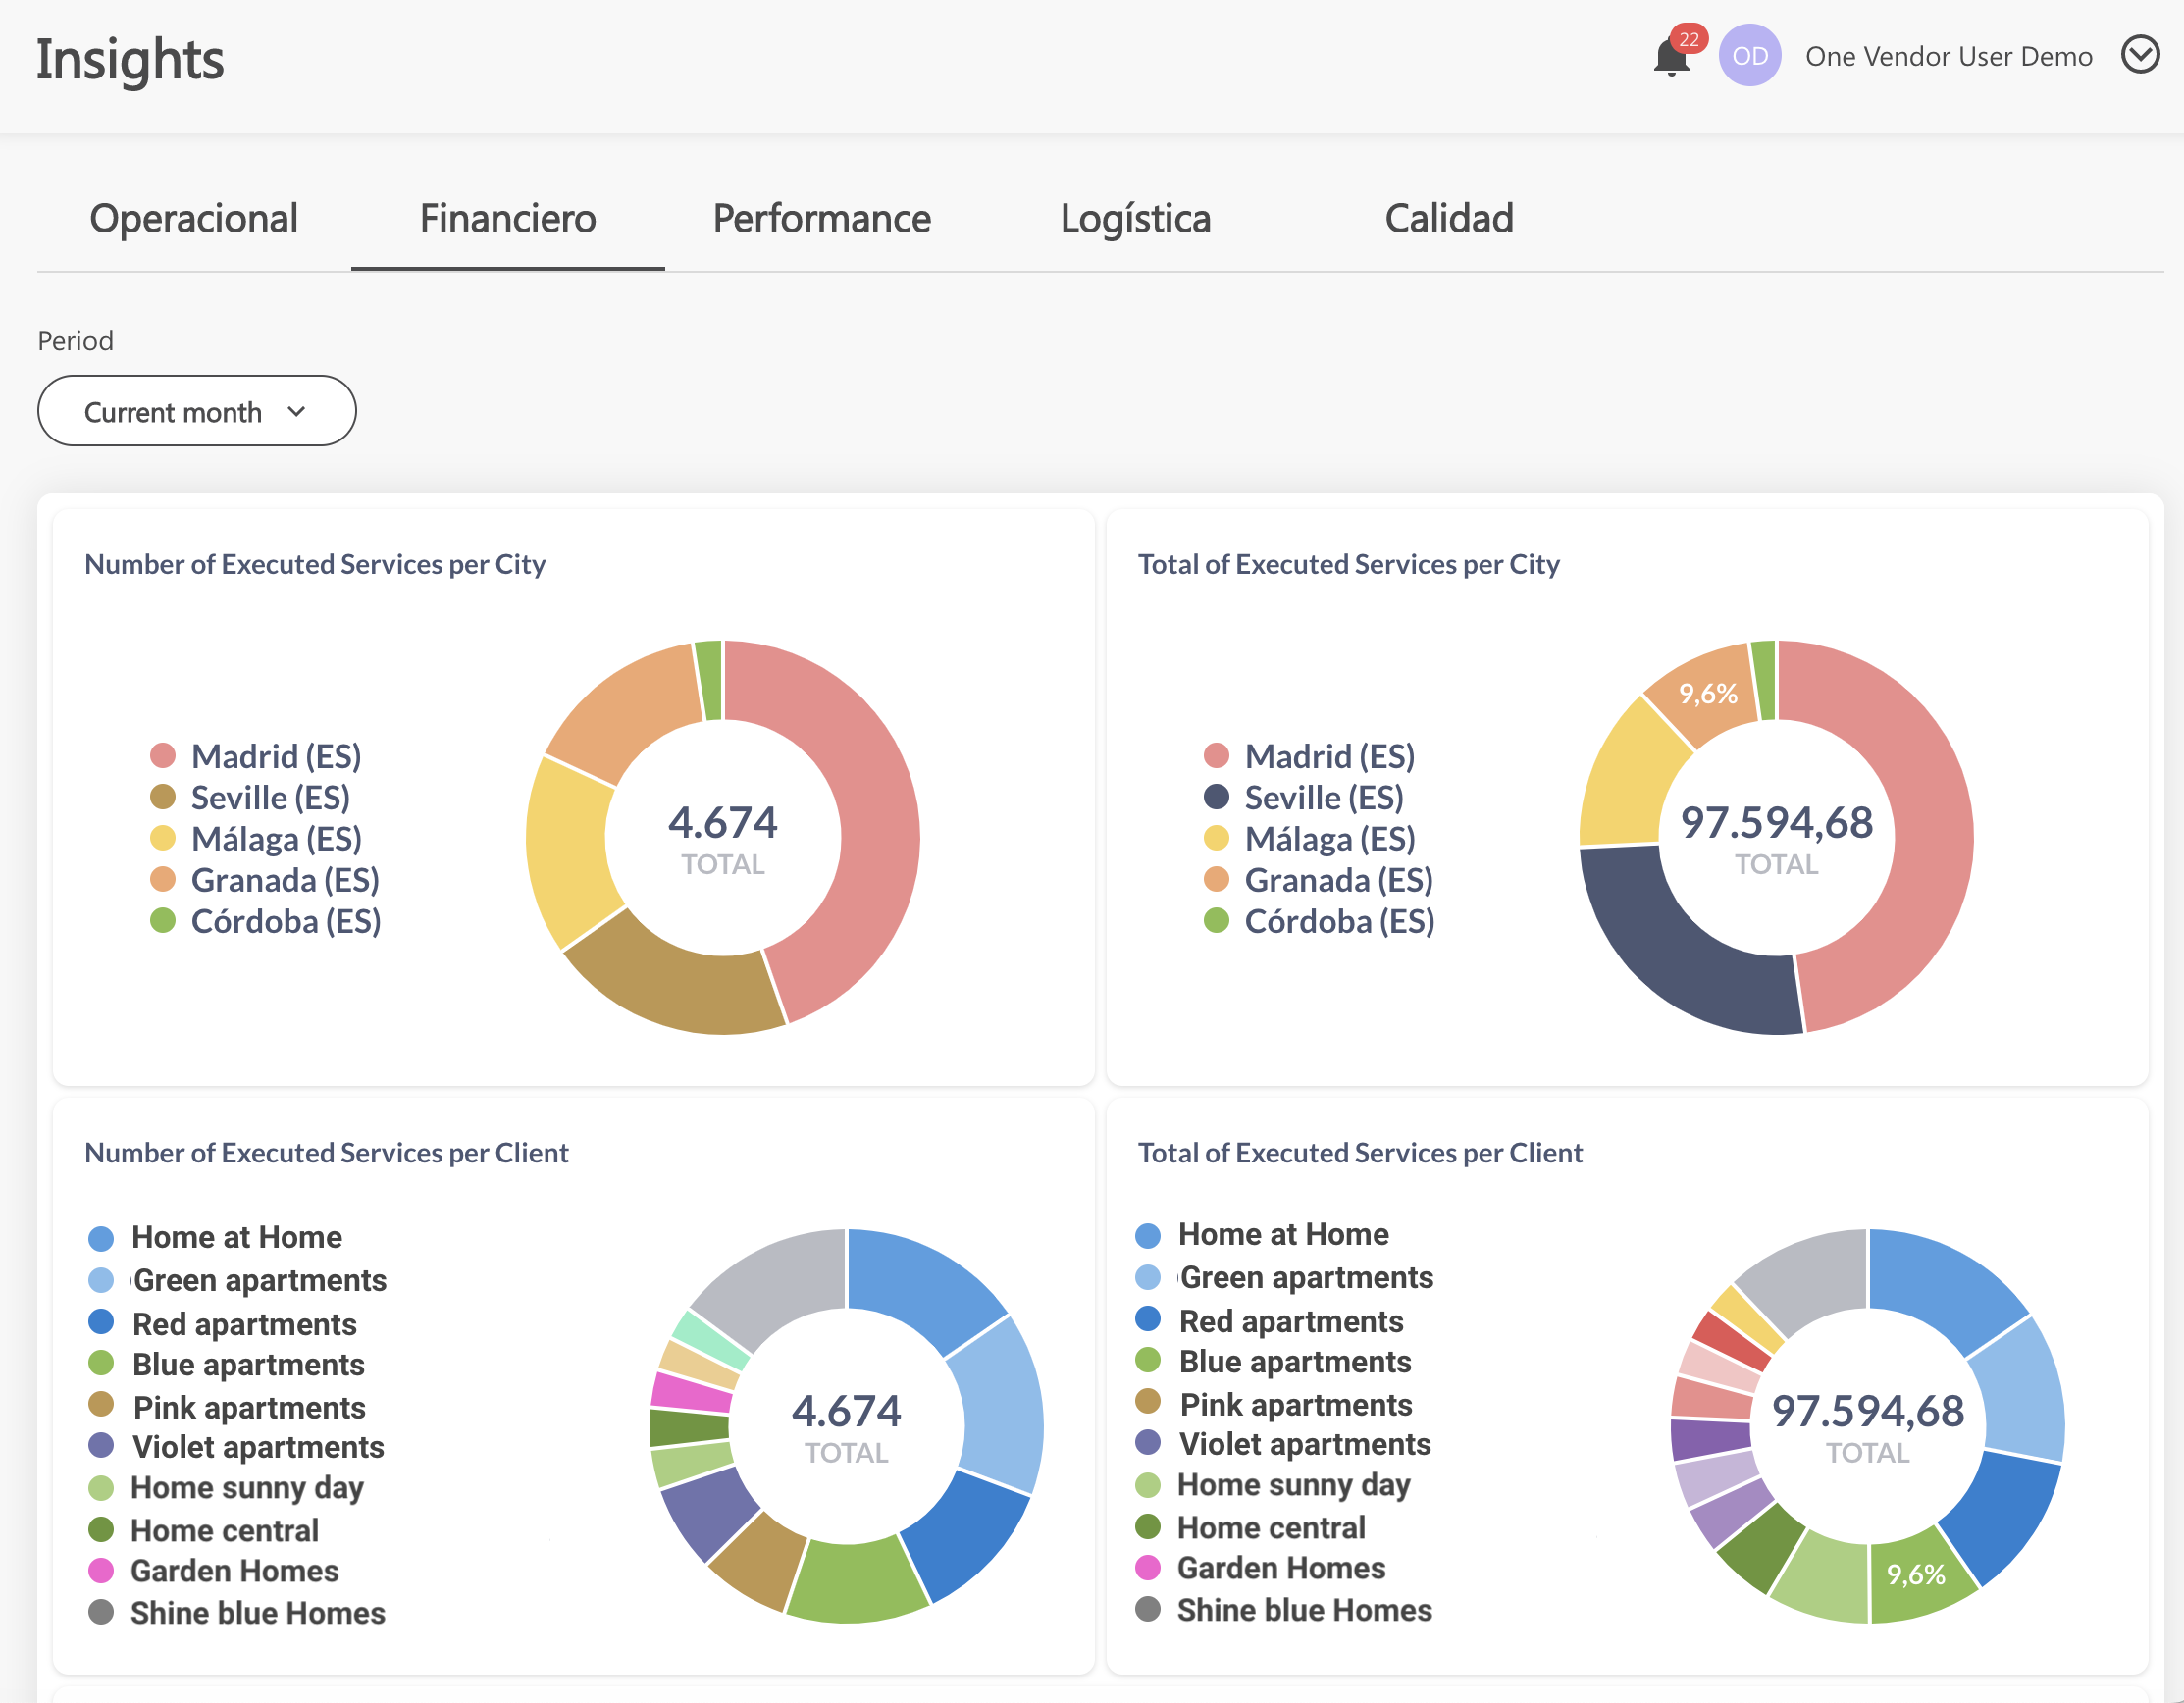
2. Financial Insights
Keep everything under control and let Doinn Financial Insights help you taking your decisions.
Navigate through the Period filter and analyze your data to forecast and predict the market.

Financial data you can analyze:
- Number of Executed Services per City
- Total Executed Services per City
- Number of Executed Services per Client
- Total of Executed Services per Client
- Total of Executed Services
- Extras Pending Payment
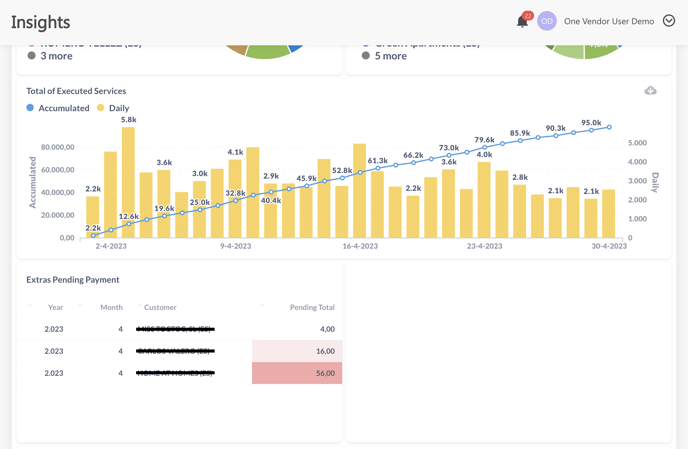
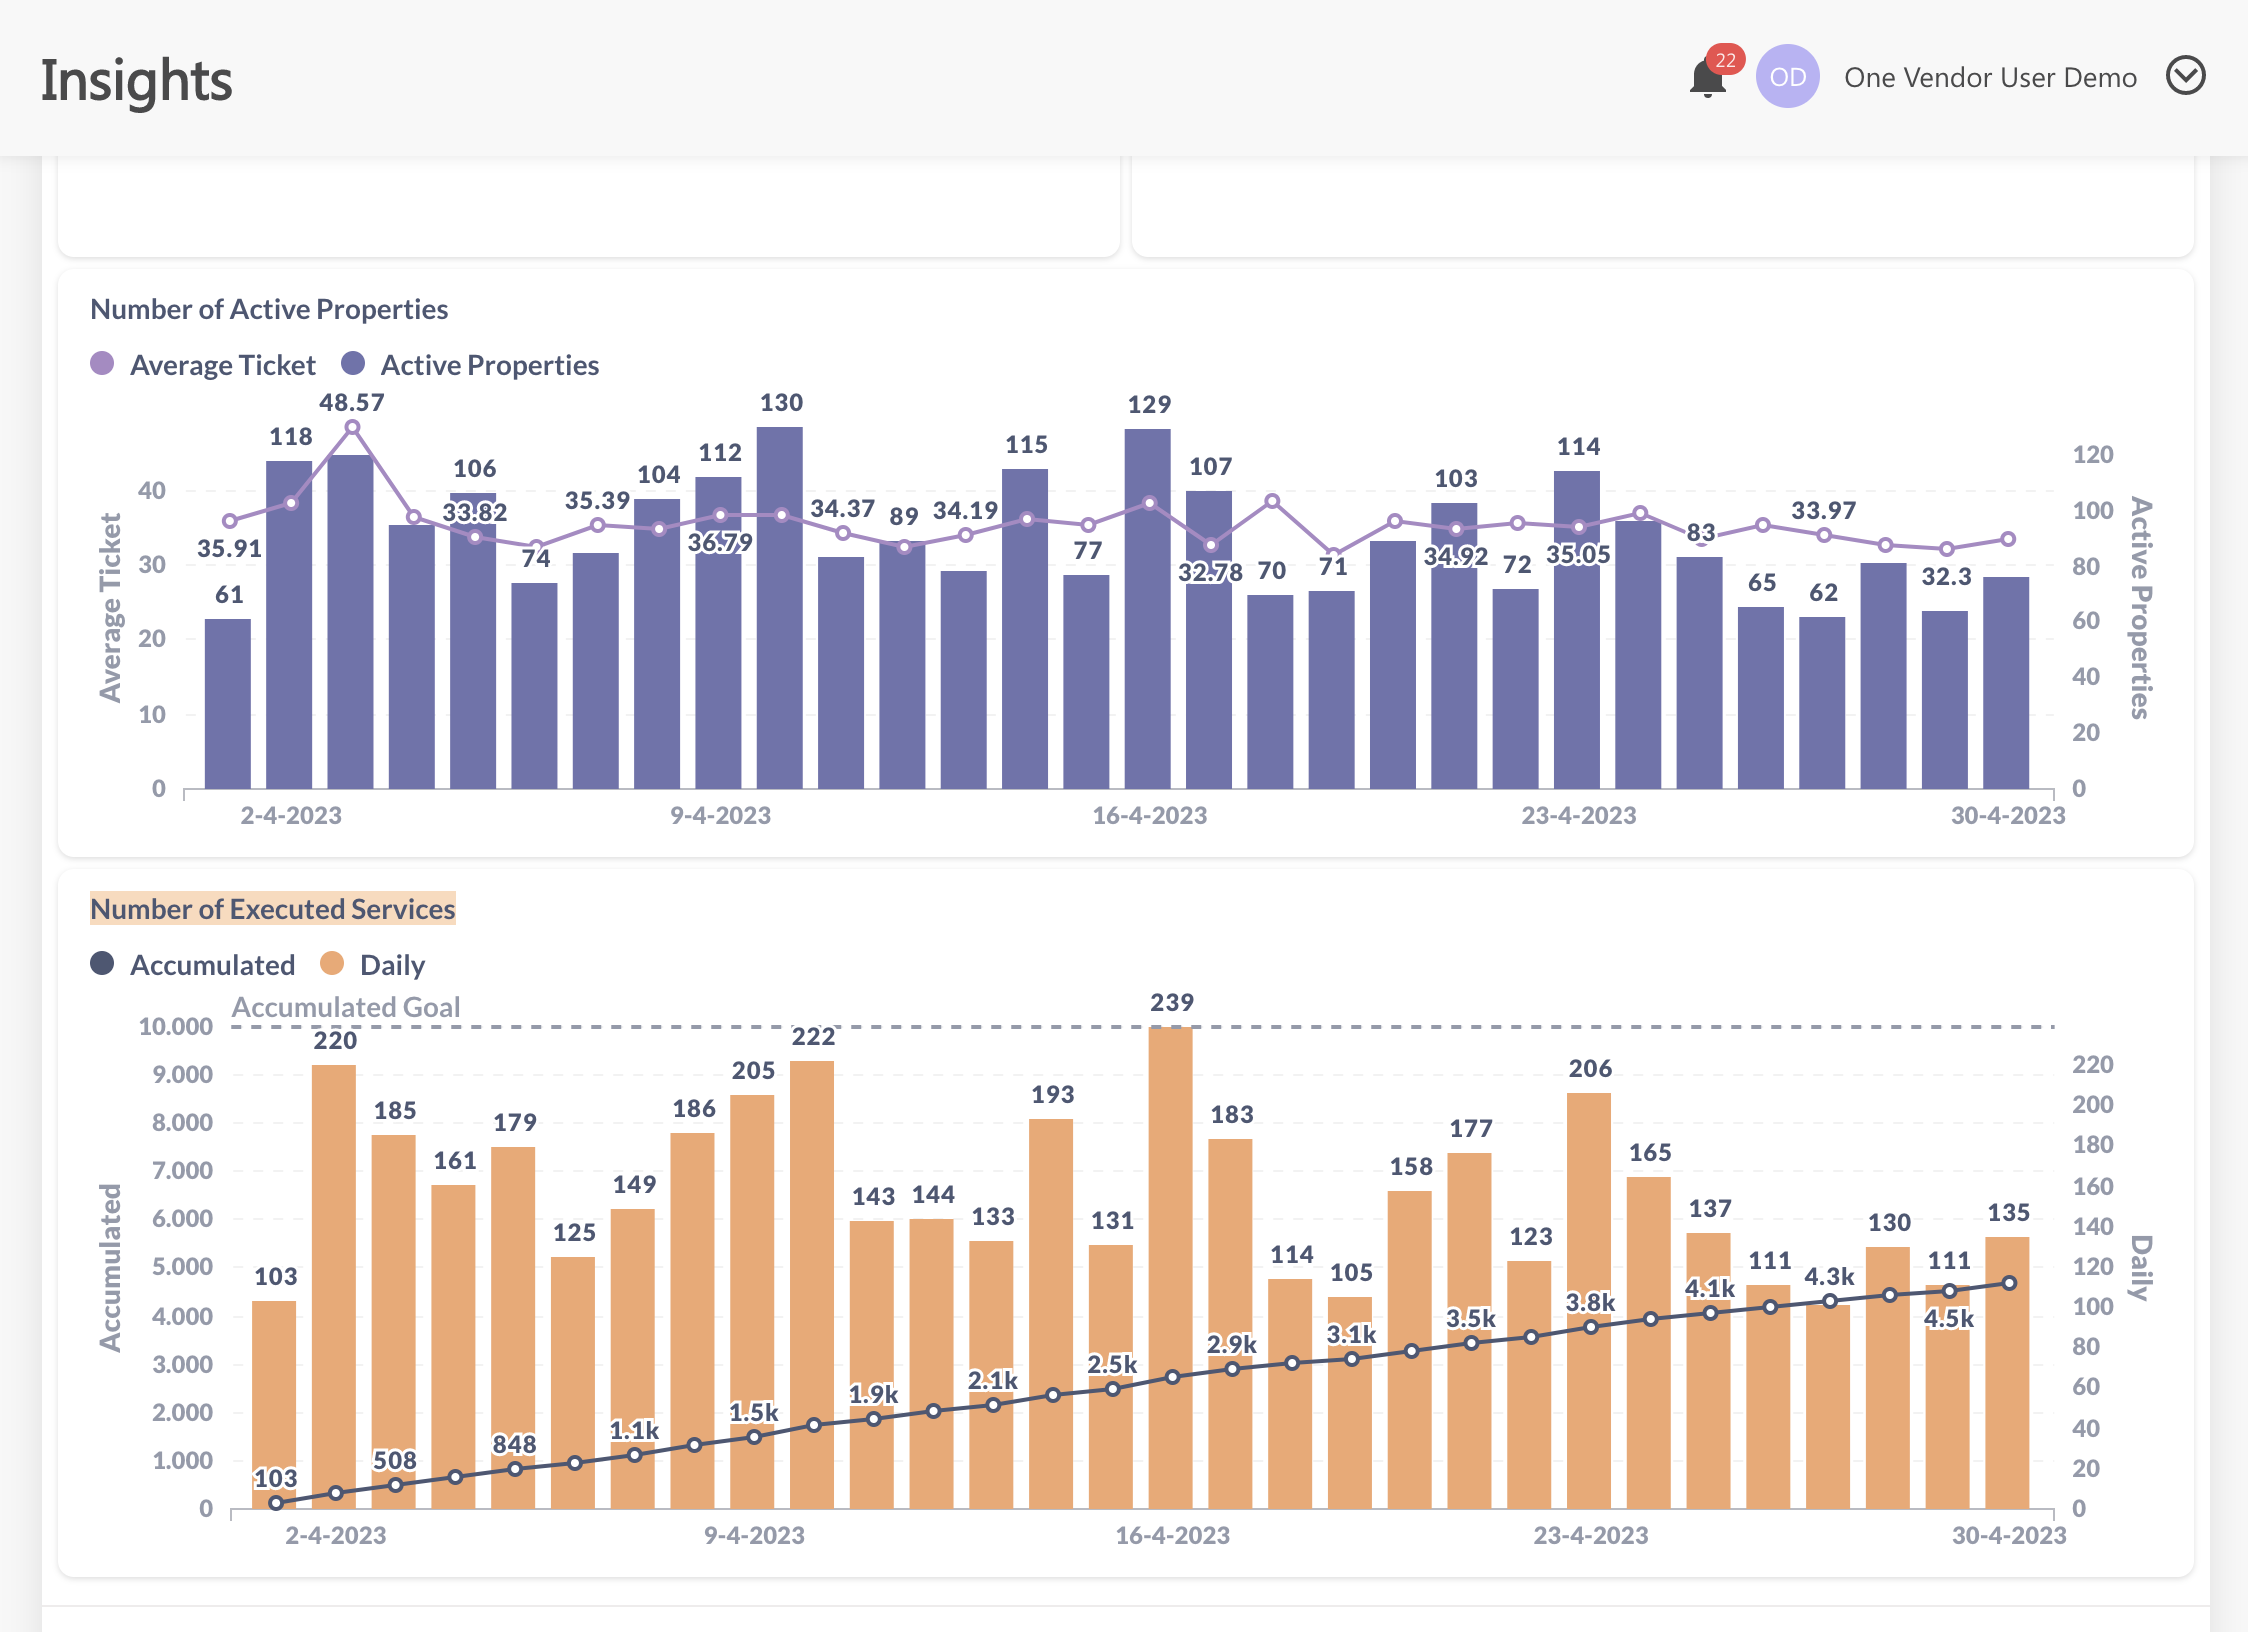
- Number of Active Properties
- Number of Executed Services
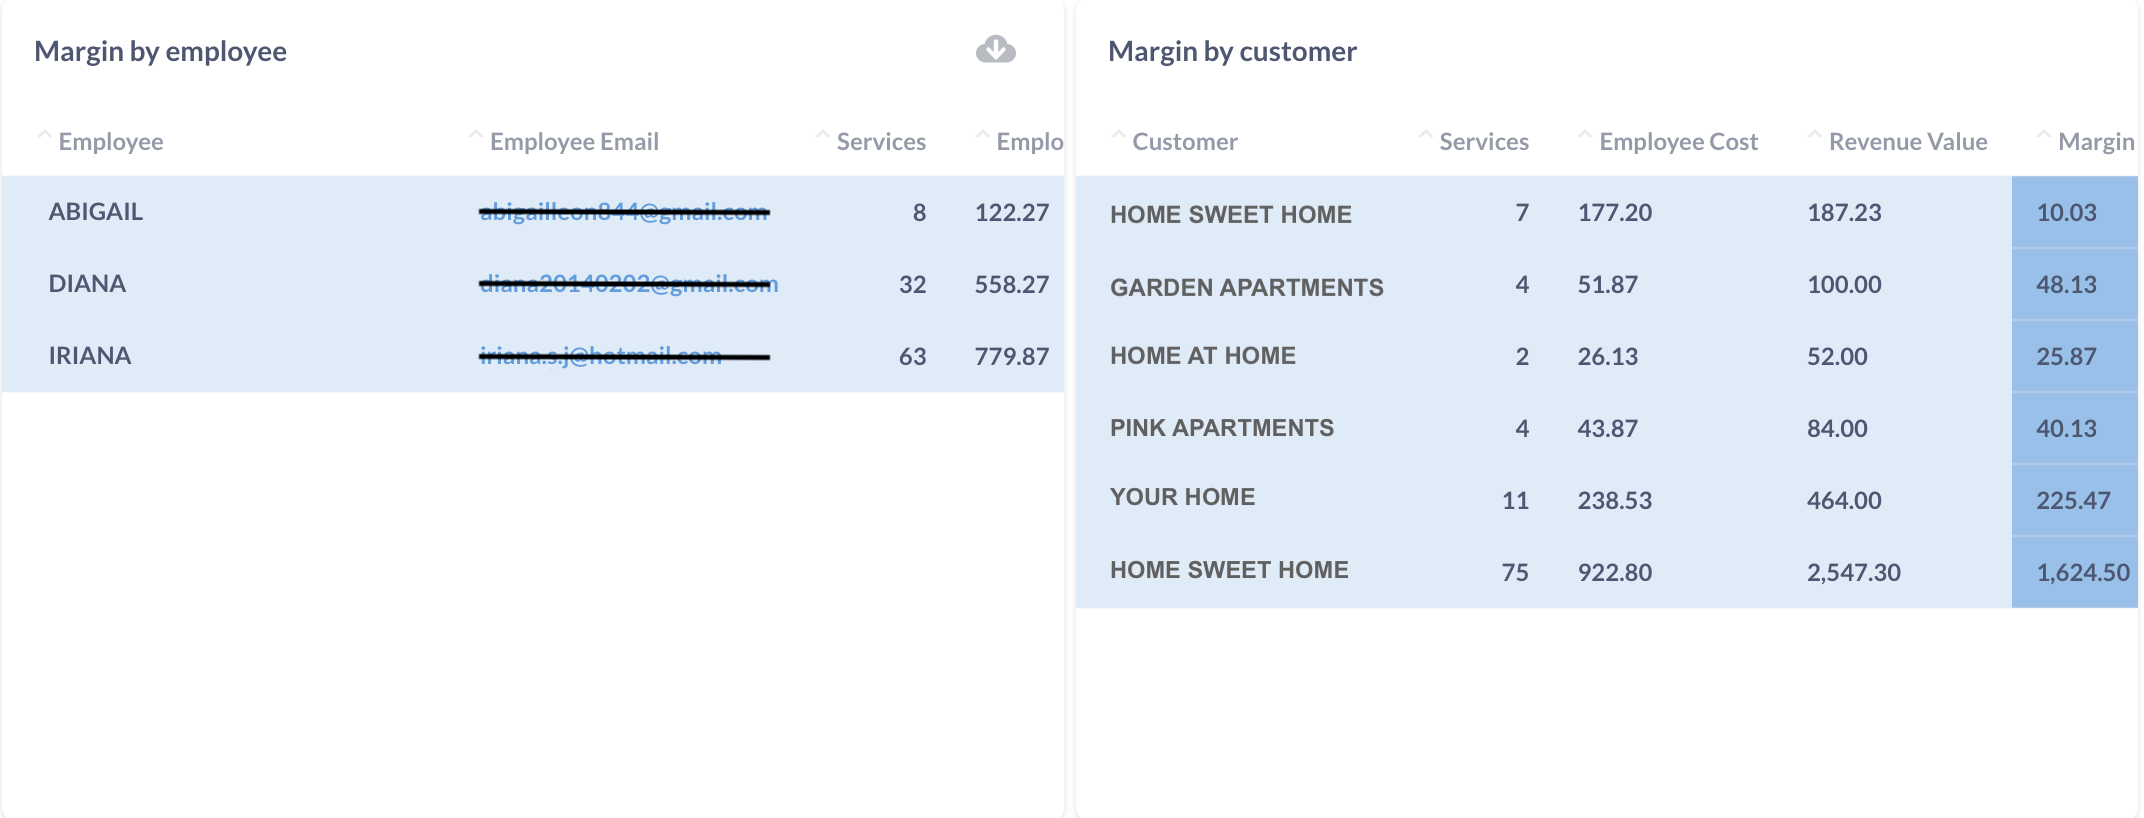
3. Performance Insights
This section gives you data that will help you get better performance through the data. Navigate through the Period filter to analyze it during the month.
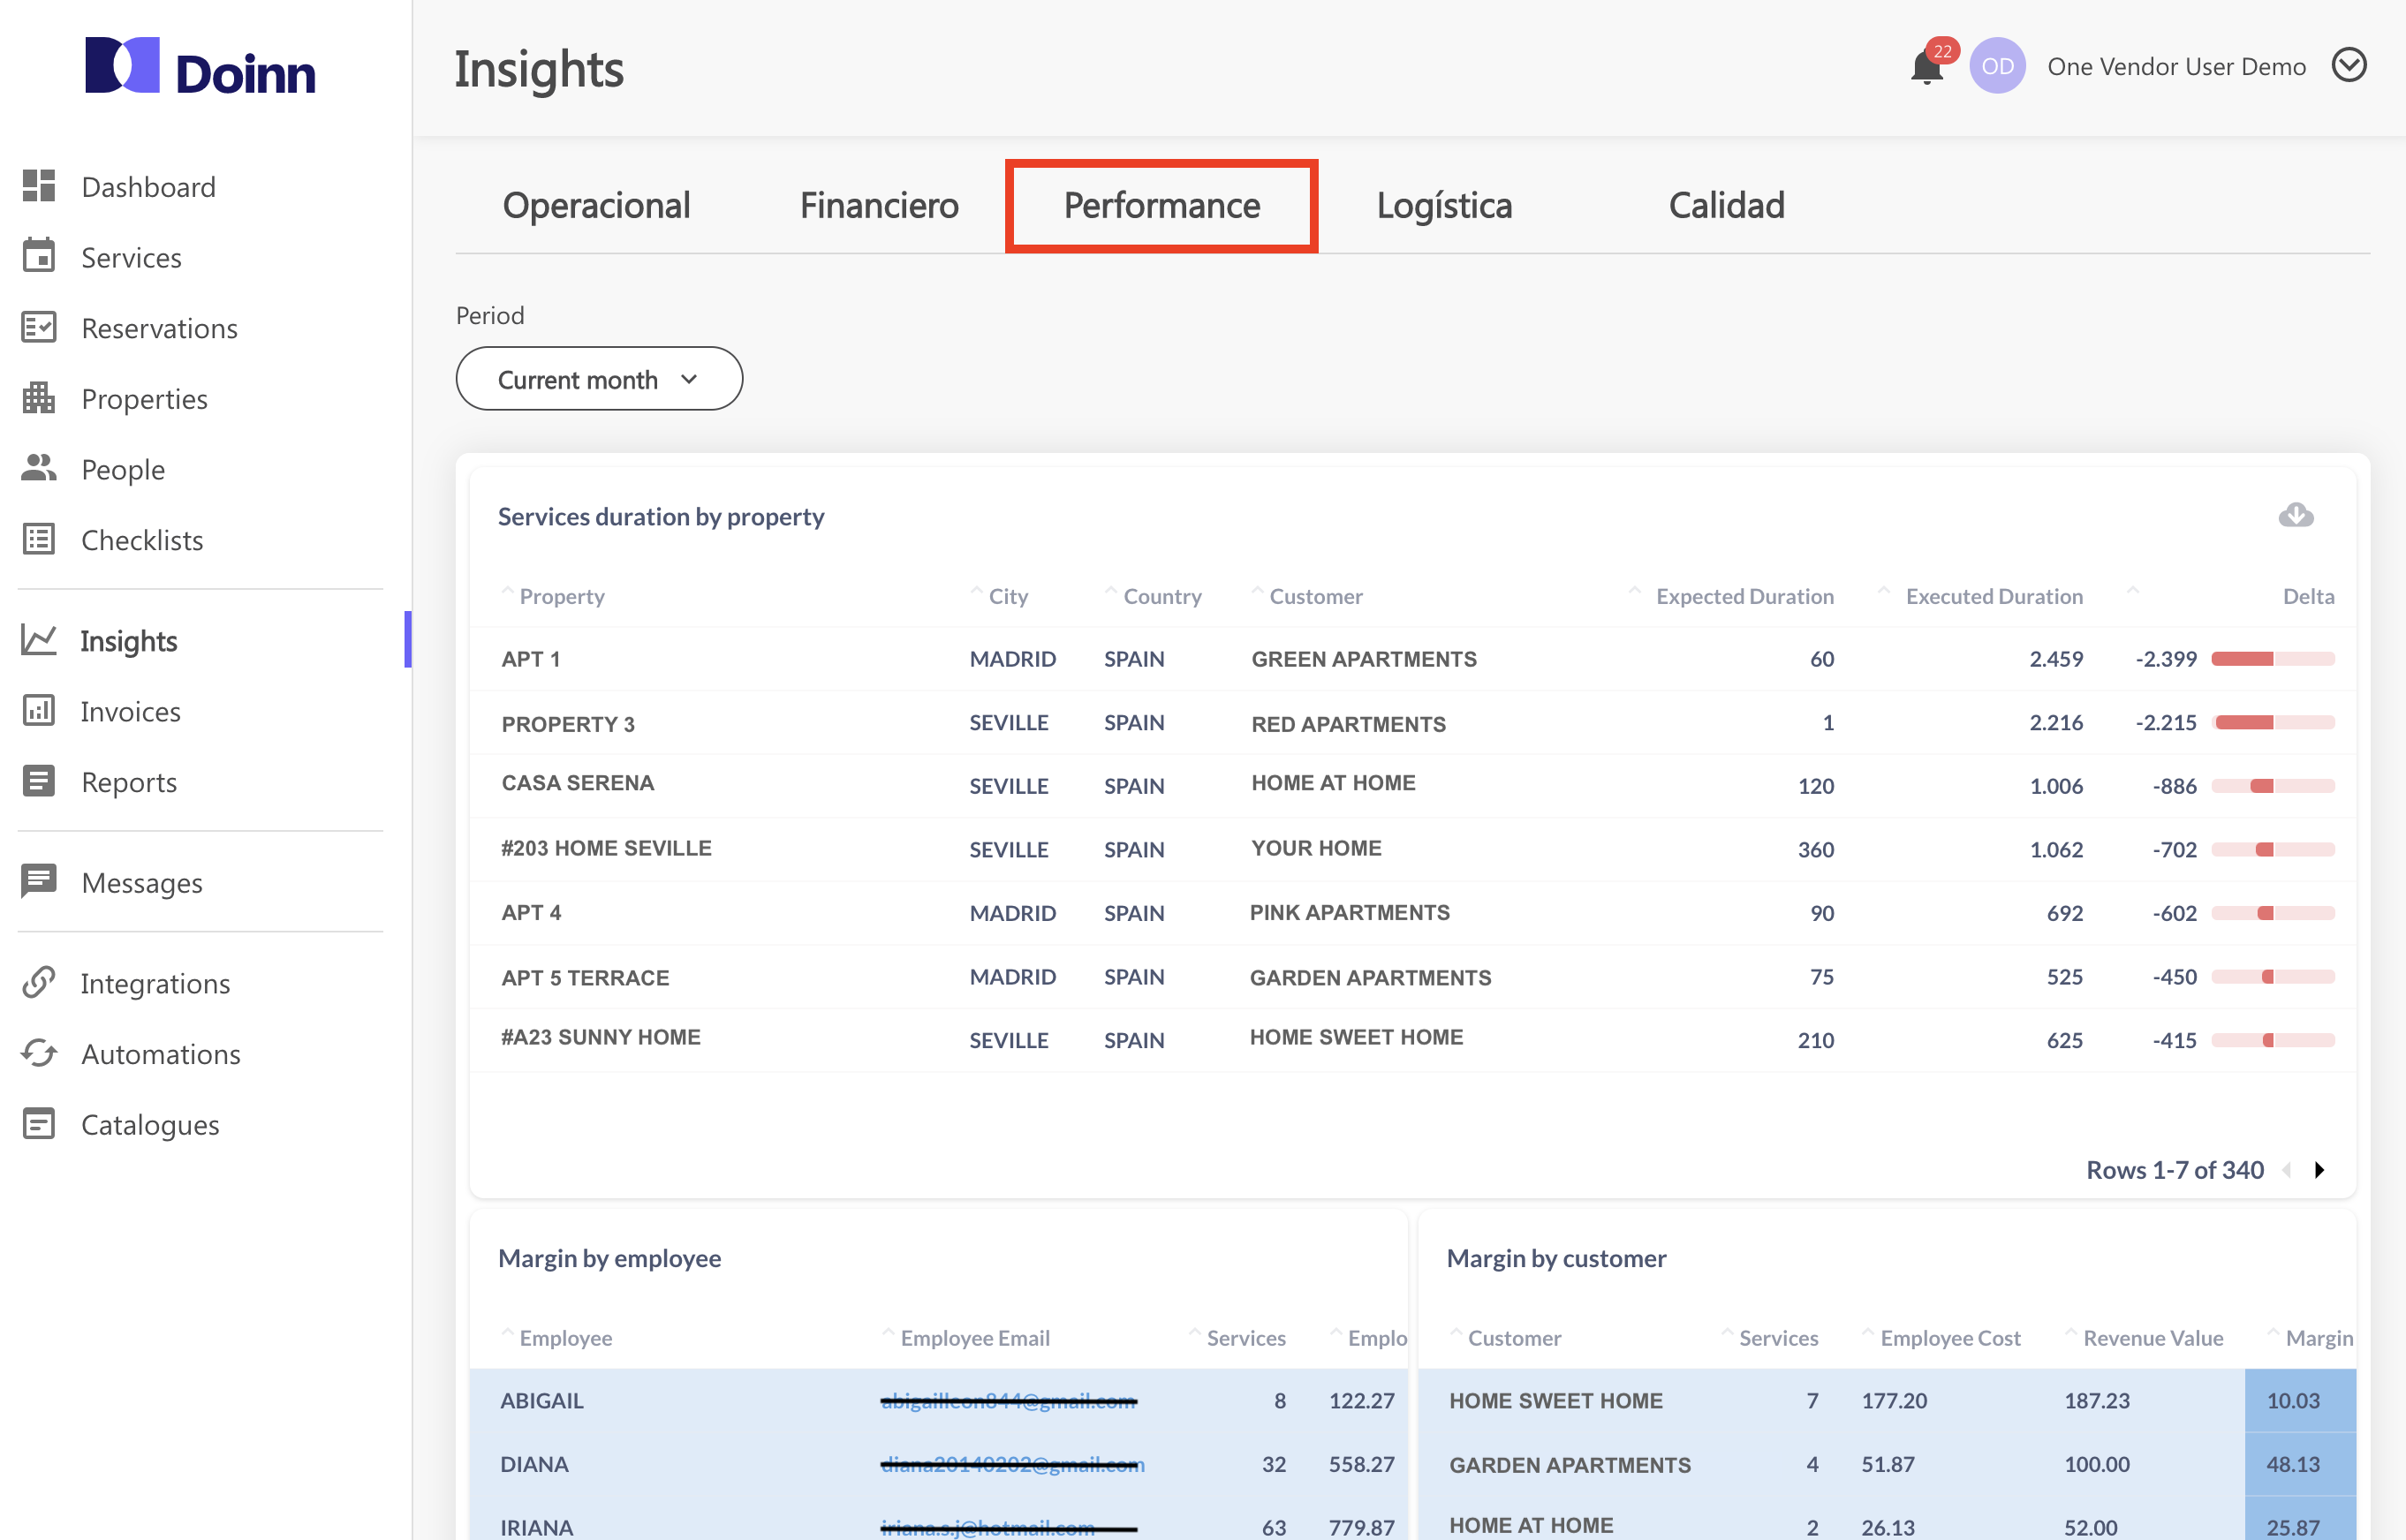
Performance data you can analyze:
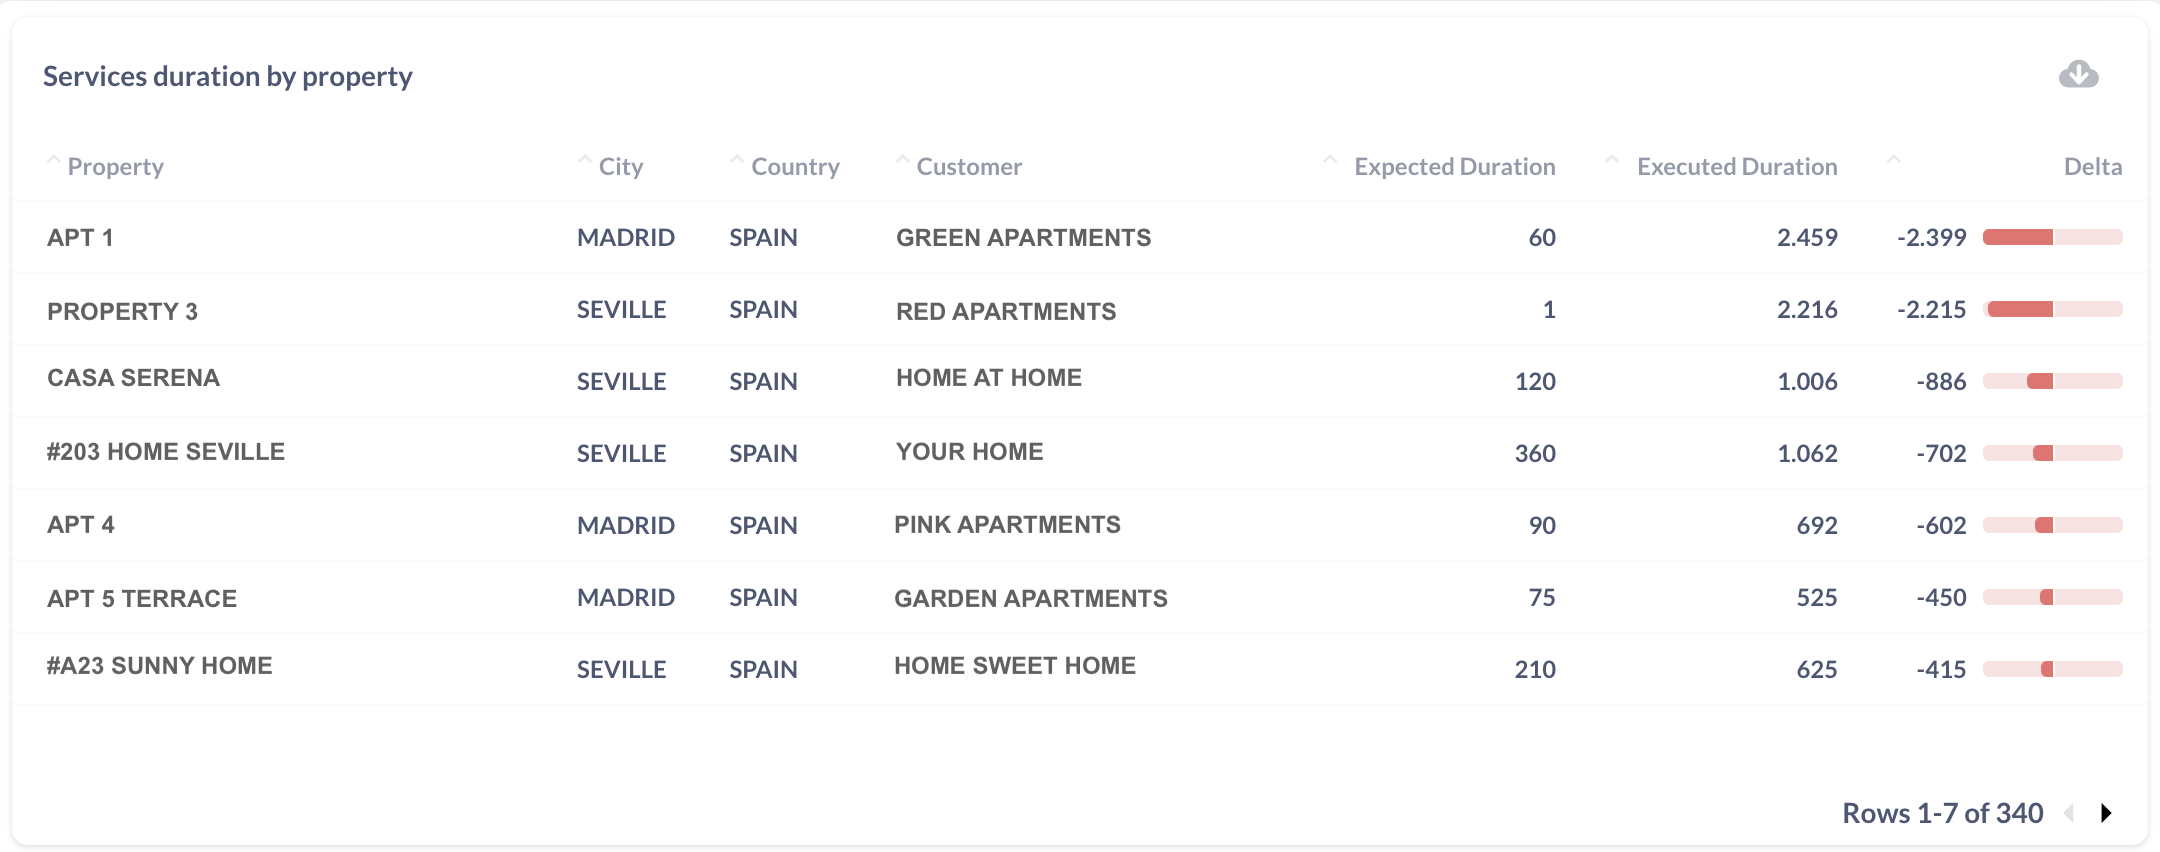
- Services duration by property
- Margin by employee
- Margin by customer
3. Logistic Insights
Keep track of the linen items needed for your services thanks to the data generated in this section.
Navigate through the Period filter to analyze it during the month.
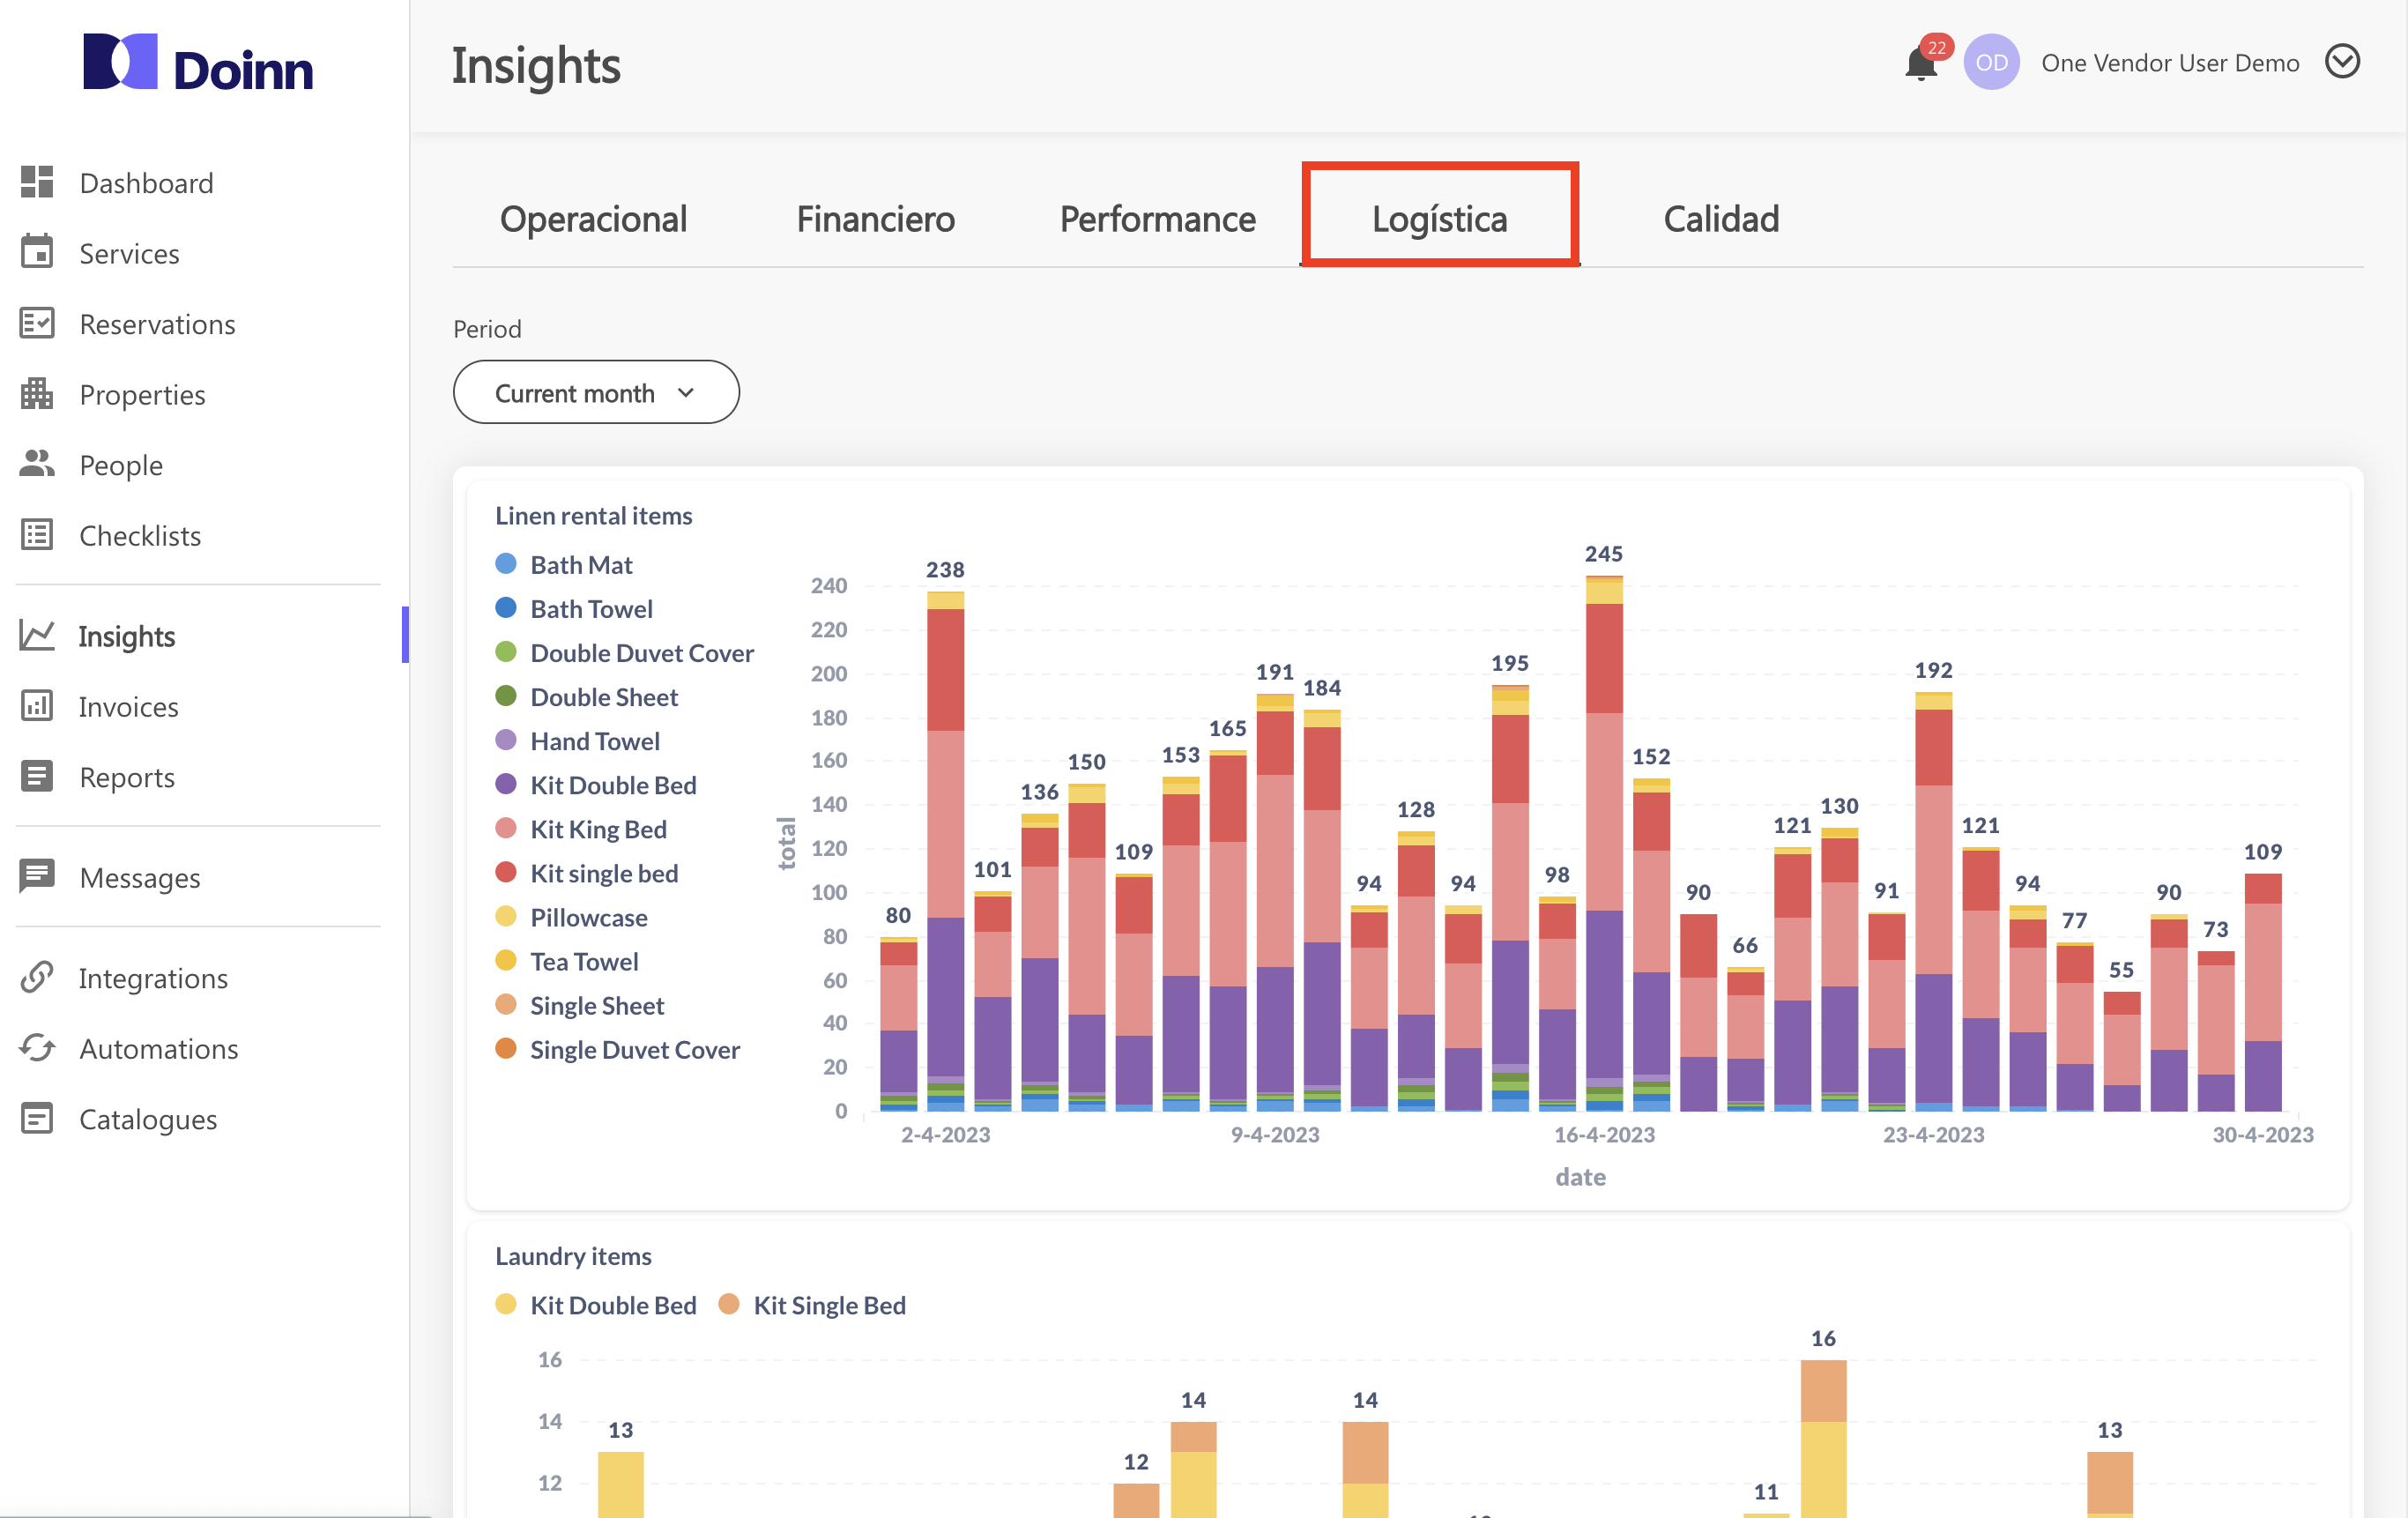
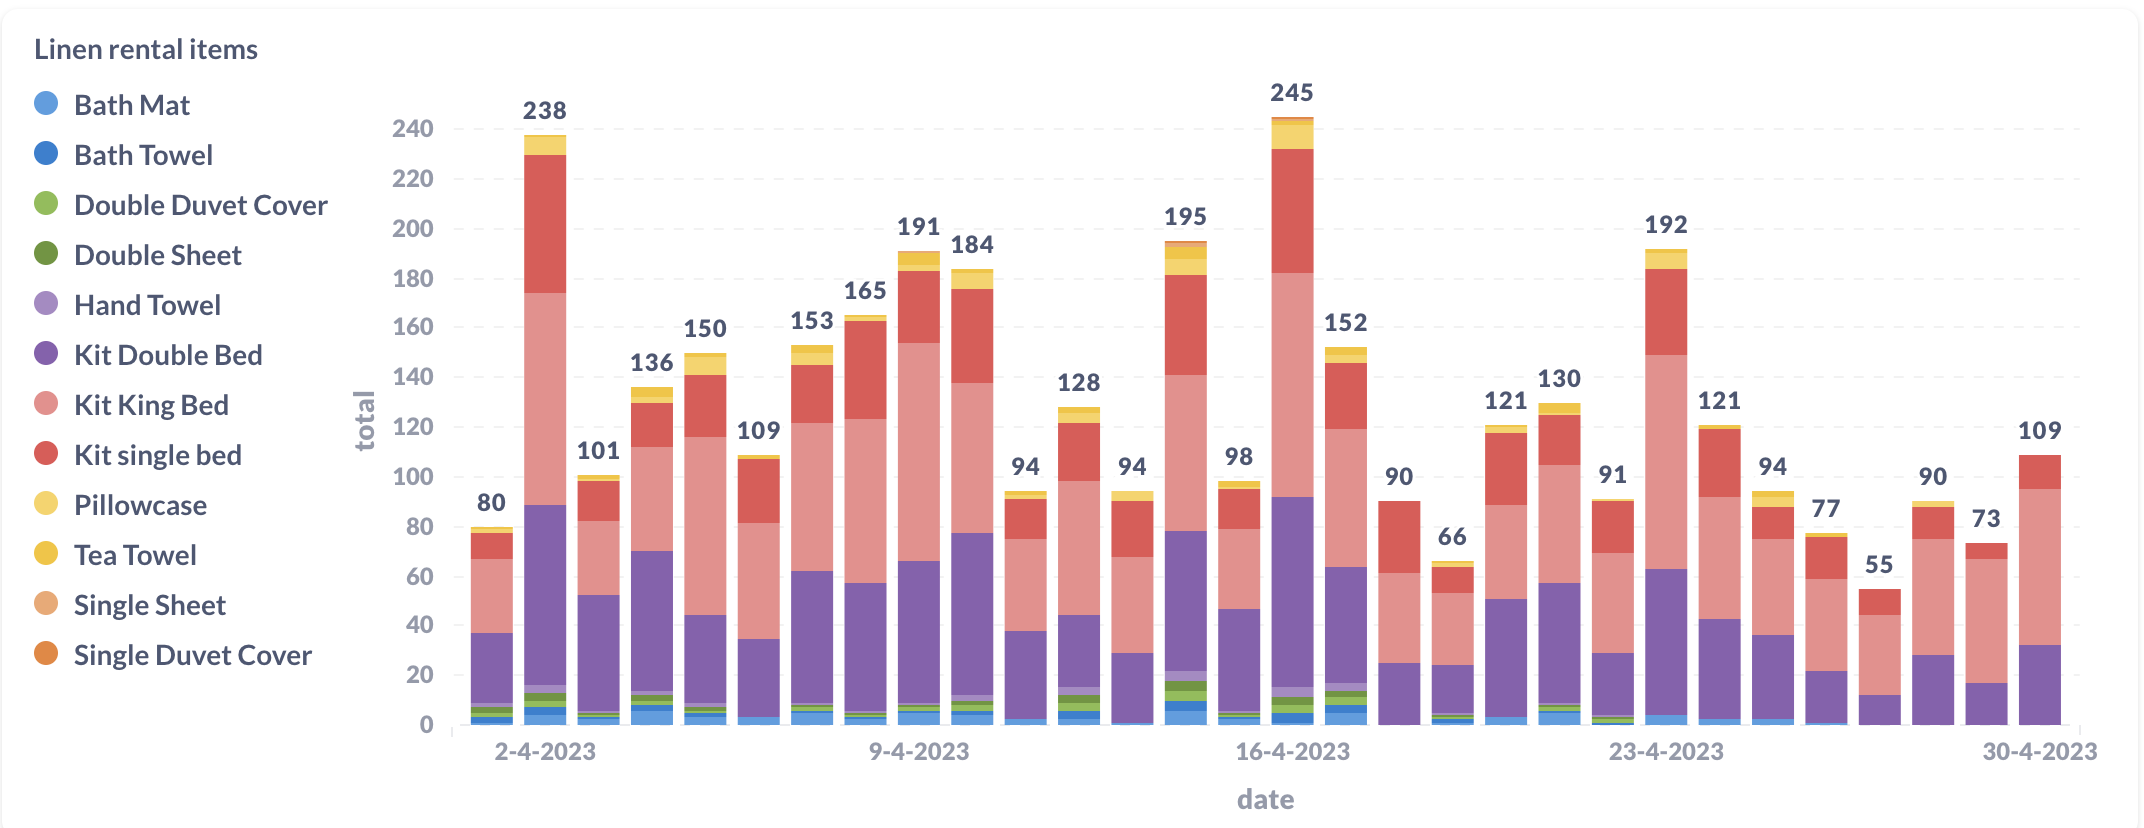
- Linen rental items
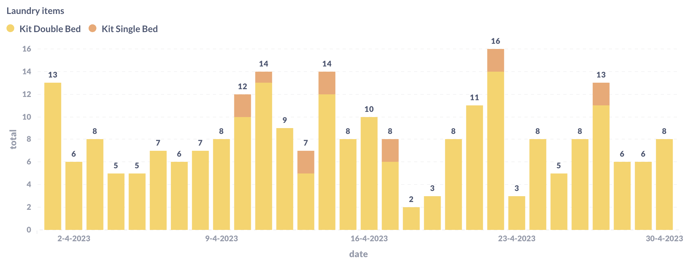
- Laundry items
4. Quality Insights
Check the issues and notes in order to better perform.
Navigate through the Period filter to analyze it during the month.
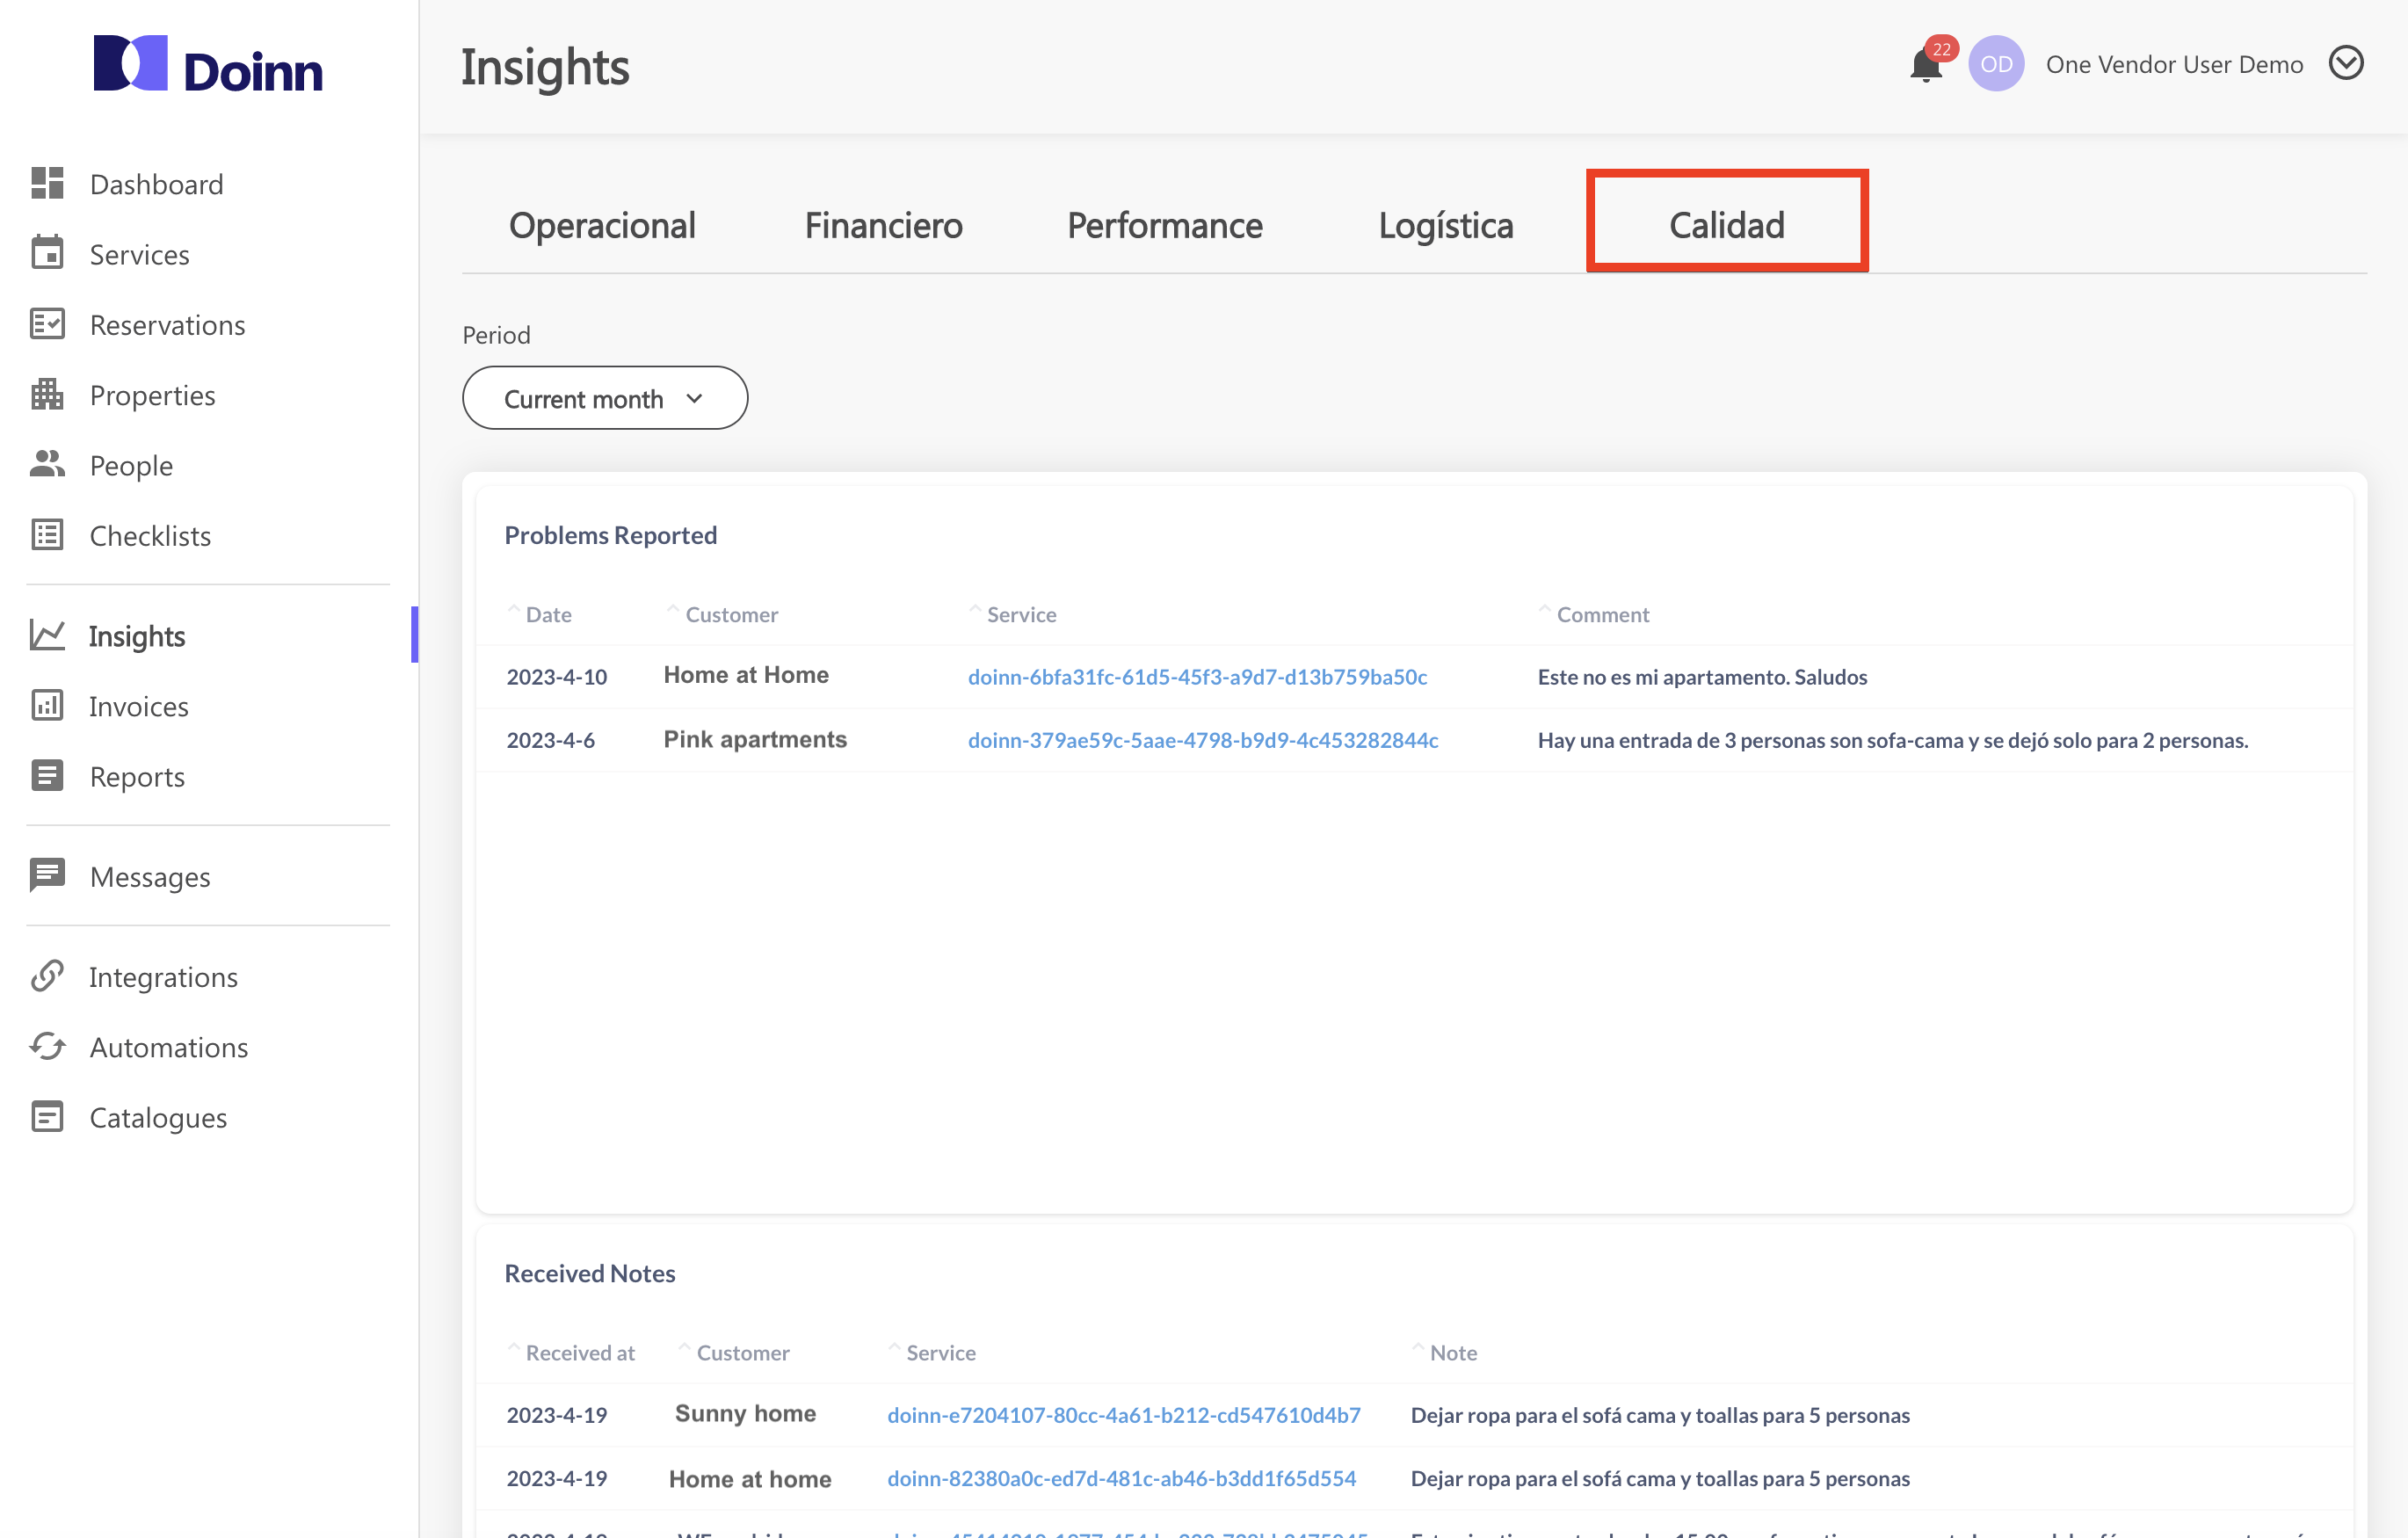
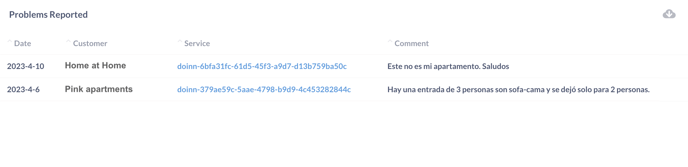
- Problems Reported
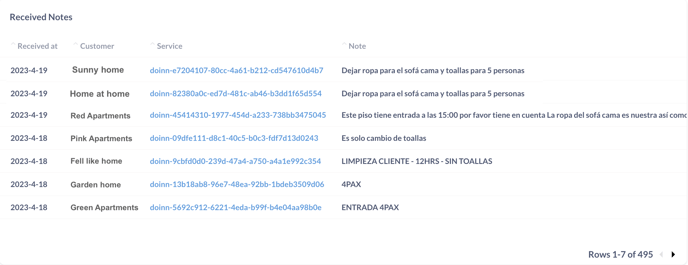
- Received Notes
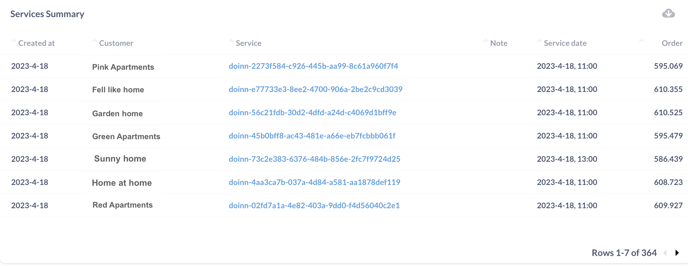
All the notes shared by your Customer will be shown here:
- Services Summary